


Privacy Policy
Terms of Service
Security
Blogs & Guides
Your dealership is losing money from missed calls and no-shows. Track these 12 BDC metrics to capture more revenue and boost appointments.
February 12, 2026
Your dealership is probably losing money right now. Not because your team isn’t working hard or your cars aren’t competitive. You’re losing it because calls go unanswered, texts sit unread for hours, and customers who want to give you business end up calling the dealer down the street instead.
The numbers are brutal:
Industry research reveals: 31.8% of customers hang up while on hold, and another 32.3% leave voicemails that often go unreturned. Even more staggering? 56 to 60% of dealership leads arrive after business hours when most stores can’t respond, and roughly 70% of people who hit voicemail call a competitor within 30 minutes.

If you can’t tell where your Business Development Center is bleeding revenue, you can’t fix it. Tracking the right BDC metrics in 2026 isn’t optional. It’s the difference between watching opportunities evaporate and systematically converting every lead into kept appointments.
This guide shows you which metrics matter, why they matter, and how to improve them. Not vanity numbers that make dashboards look pretty. Measurements that reveal whether your BDC is a profit center or a cost sink.
A dealership BDC exists to do one job: turn customer intent into kept appointments that generate revenue and repeat business. Everything else is noise.
Answer rates, response times, talk tracks, and fancy software only matter if they move that job forward. Too many dealers track activity (calls made, emails sent) while revenue walks out the door.
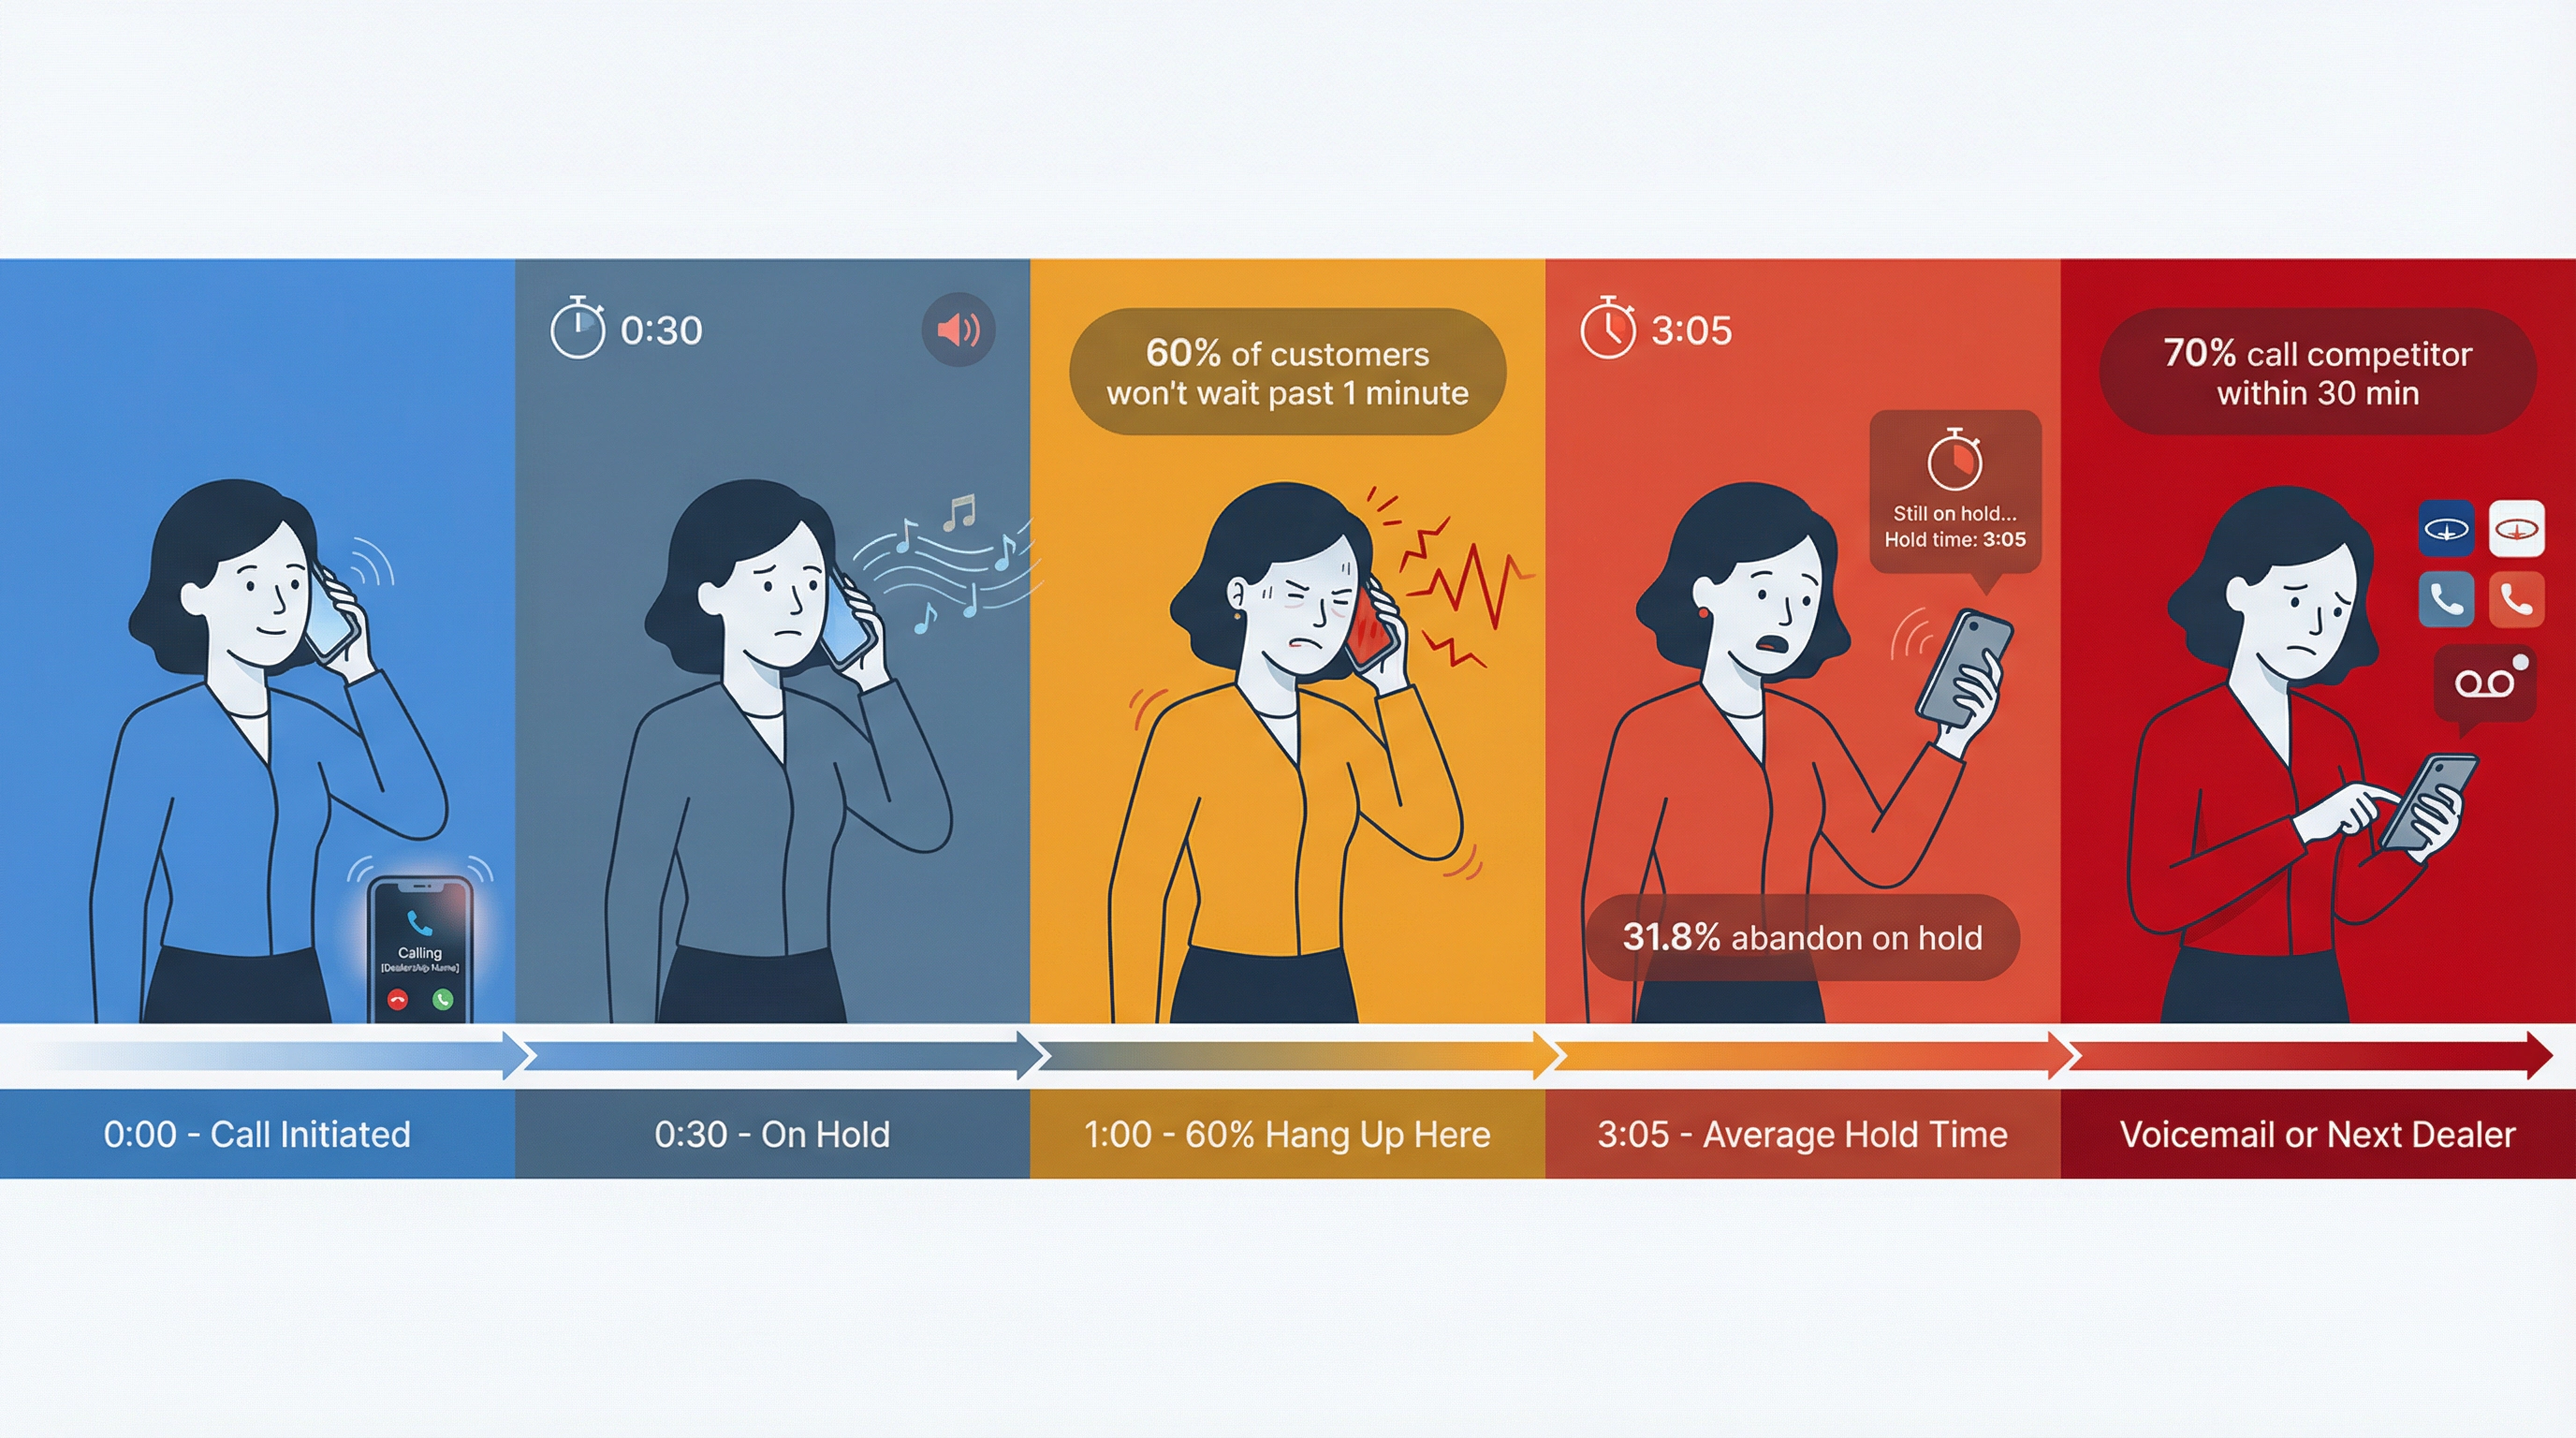
Despite all the technology available in 2026, missed calls remain one of the most expensive failure modes in dealerships. Analysis of nearly 3,000 dealerships found that the average hold time was 3 minutes and 5 seconds. Customers don’t wait that long.
Research shows 60% of customers hang up after just one minute on hold, and 32% won’t wait at all.
The cost of missed calls: Every abandoned call is demand that showed up and left. According to industry estimates, dealerships lose over $1 million per store per year from missed service calls alone. That’s not counting lost sales opportunities.
Pied Piper’s 2025 Internet Lead Effectiveness study submitted leads to 4,023 dealership websites and measured responses across email, phone, text, and chat over 24 hours.
Industry analysis reported that dealers responded via multiple paths (email + phone + text) only 49% of the time. While 85% responded through at least one path, most dealerships can say “we responded” but fewer can say “we reliably reached them.”
In 2026, if you’re not tracking multi-channel contact rates, you’re measuring the wrong thing.
Build your KPIs around this framework (both service and sales map to it):
① Inbound demand (calls, texts, emails, web leads)
② Connection (did we actually reach the customer in a real conversation?)
③ Qualification (is this a real opportunity we can act on?)
④ Offer (did we ask for the appointment or propose next steps?)
⑤ Appointment set
⑥ Appointment kept (show/arrive)
⑦ Outcome
⑧ Value (gross profit, CSI, retention)
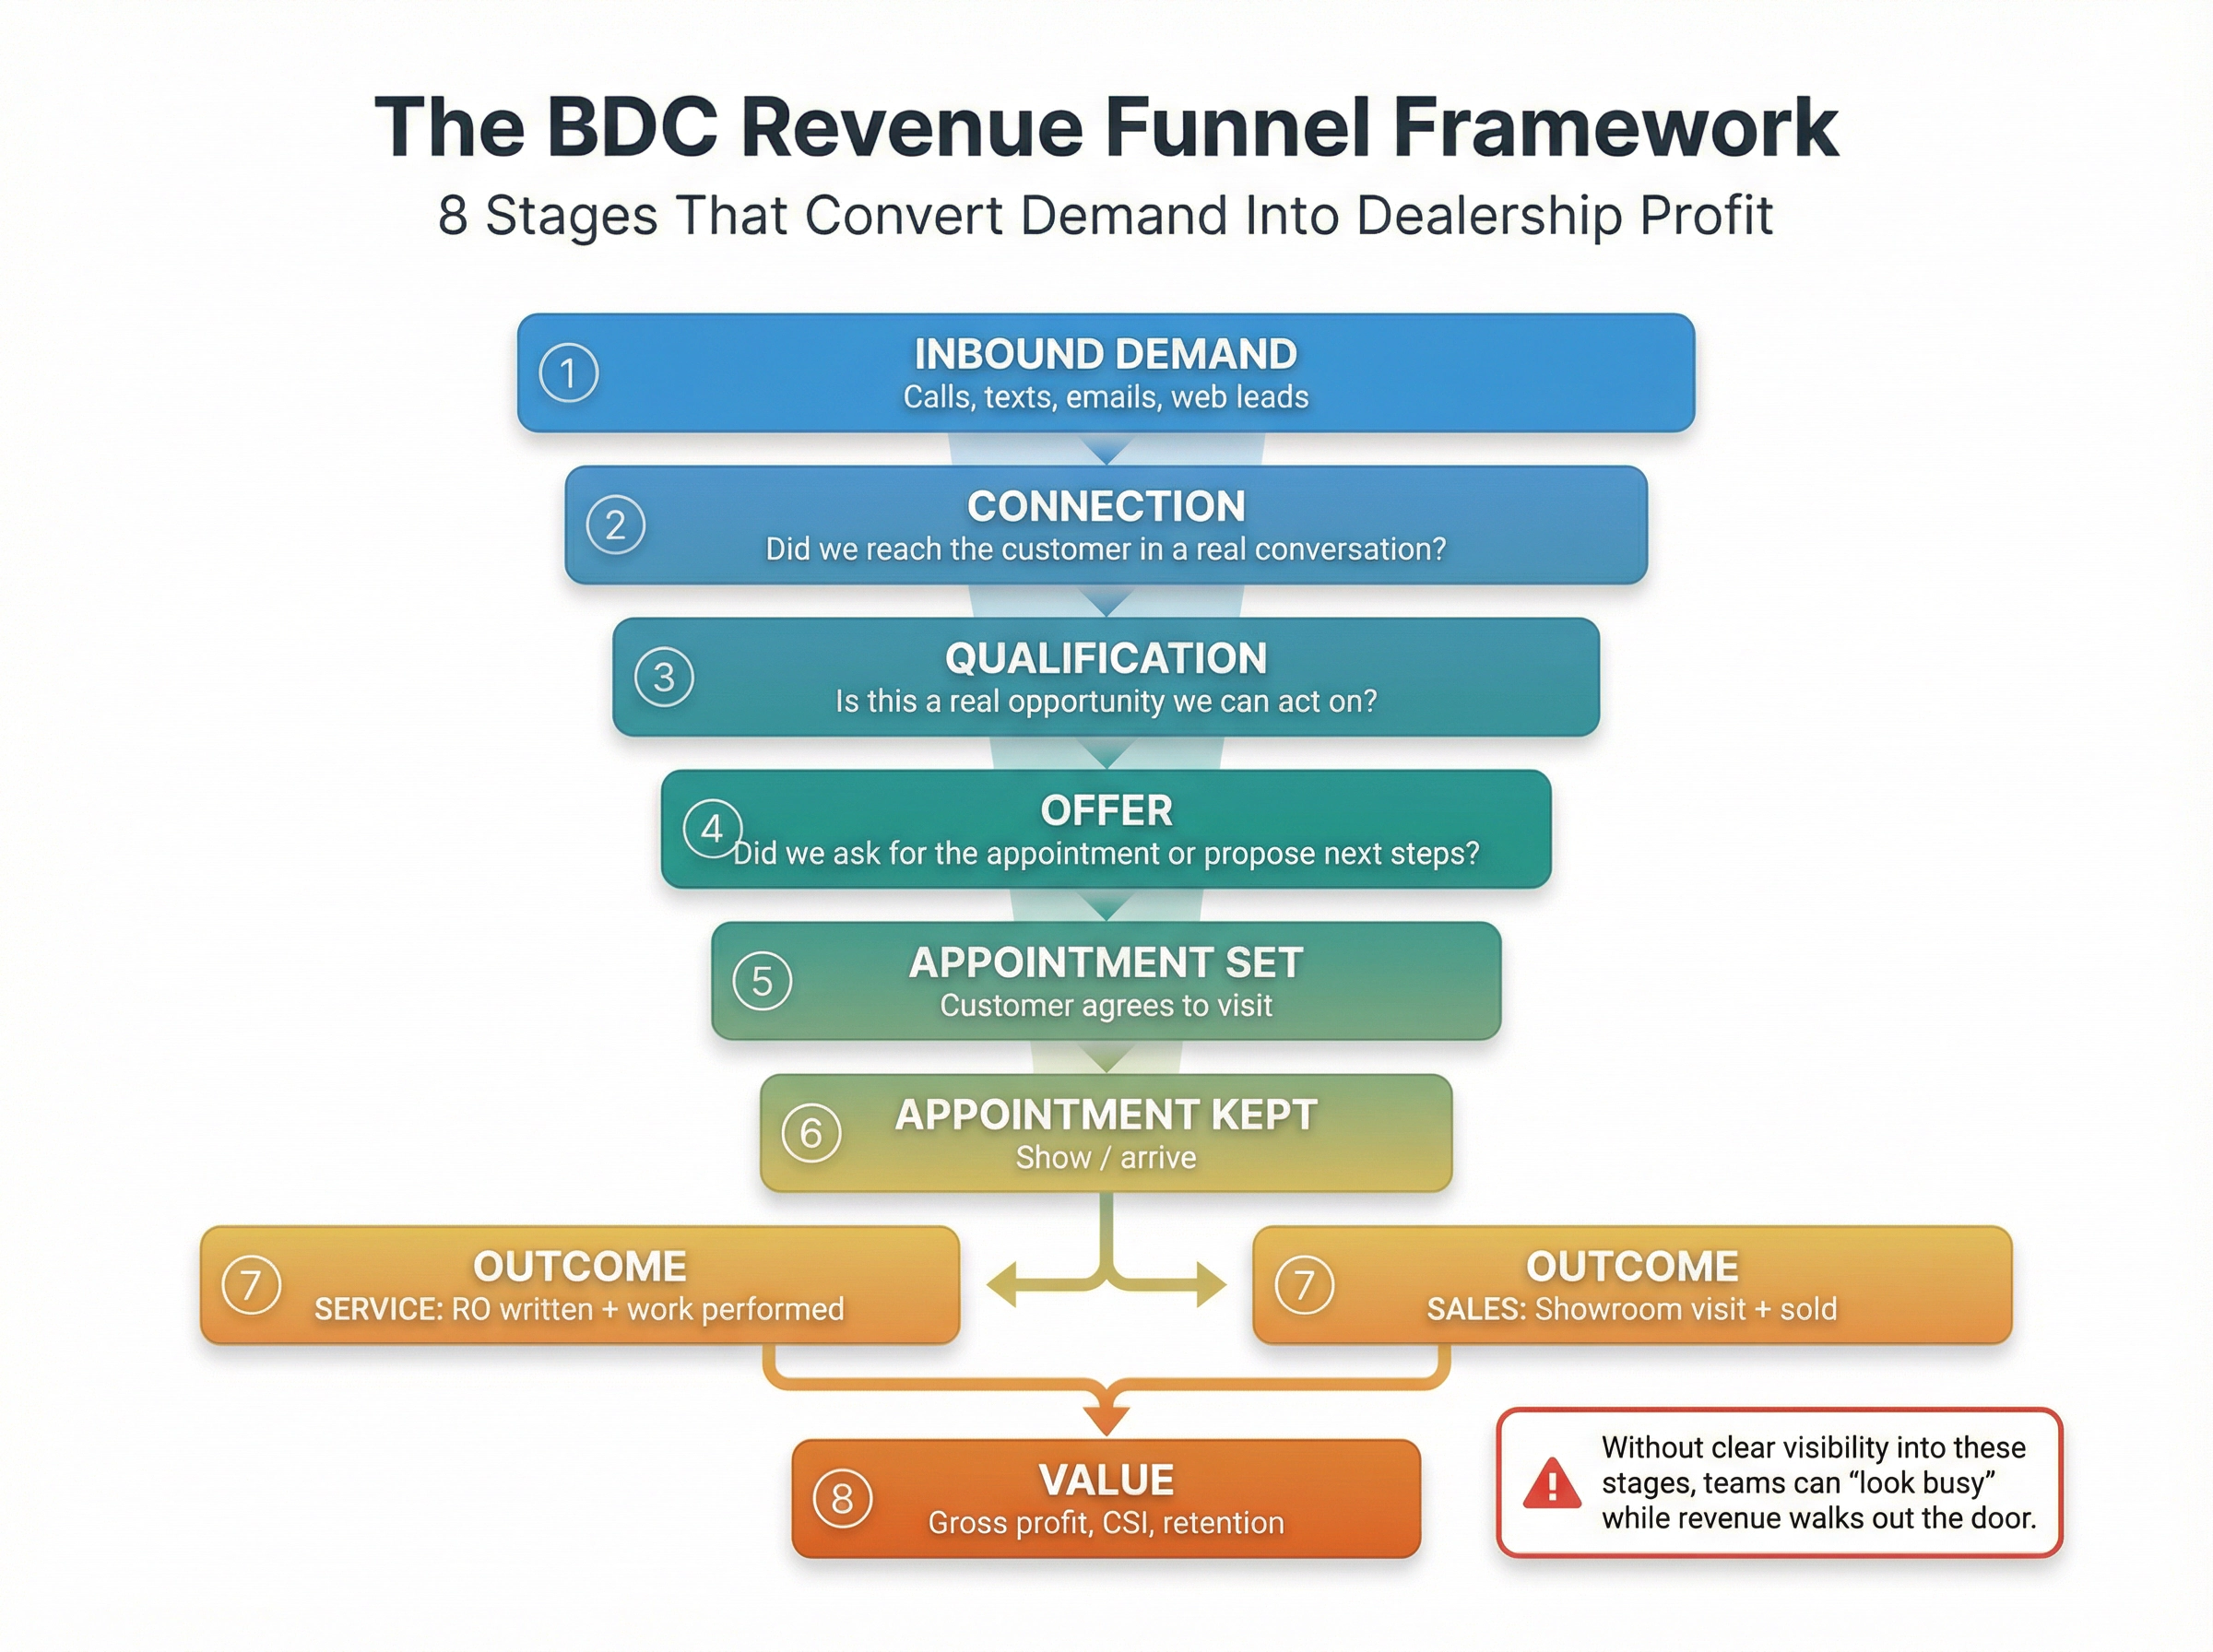
If your dashboard doesn’t show these stages clearly, your store can “look busy” while losing money. Reps making calls, sending emails, and sitting in CRM all day with nothing to show for it on the P&L.
If you only track a dozen metrics, track these. They cover the entire funnel and force accountability at every stage.
What it is: Count of inbound attempts, split by phone, SMS, email, chat, and web leads.
Why it matters: If you don’t know demand, you can’t talk honestly about staffing, vendor ROI, or even “missed calls.” Many stores track “leads” but not “calls,” or track “calls” but not texts.
You can’t staff for Monday morning rushes if you don’t know when demand peaks. You can’t justify (or cut) that third-party lead source without measuring its volume against conversion.
What to track:
→ Build a single daily number: total inbound attempts
→ Break it out by channel (phone, text, email, chat, web forms)
→ Segment by hour to identify peak periods
→ Compare week-over-week and month-over-month trends
How to improve: Most improvement comes from marketing and lead generation strategy, but tracking reveals whether your investments are working. If a campaign drives inbound volume but those leads don’t convert, you’ll see it downstream. If certain channels consistently outperform, double down there.
Formula: Calls answered ÷ total inbound calls
Why it matters: You cannot sell or schedule what you never speak to.
Analysis of nearly 3,000 dealerships found that only about 65.2% of inbound calls were actually connected to an agent. One in three callers never got through, and those abandoned calls often don’t call back.
Definition rule: Count a call as “answered” only if a human (or approved automated agent) speaks with the caller. IVR that dumps them into hold or voicemail counts as unconnected.
What to track:
Industry data shows 10:00 AM to 12:00 PM is the busiest inbound window each day, with Monday being the busiest overall. If you know your hot zones, you can staff accordingly.
How to improve:
Don’t only track the average. Track the distribution.
What to track:
Why it matters: Averages hide pain. Your customers experience the tail, not the mean.
An average hold time of 3:05 sounds manageable. But that average includes calls answered instantly and calls where someone waited five minutes before hanging up. If your 90th percentile hold time is seven minutes, you have a serious problem even if your average looks okay.
Action: Make “calls answered within X seconds” a daily KPI. Pick X based on your market (30 seconds is aggressive but achievable), then ratchet down over time.
How to improve:
• Reduce call transfers that add hold time
• Train reception to answer faster
• Use overflow routing during peaks
• Alert management when hold times spike in real-time
Formula: Calls abandoned ÷ total inbound calls
Why it matters: Abandonment is demand that showed up and left. Break it into categories:
Each type has a different fix. IVR abandonment means your menu is too complex. Hold abandonment means staffing or routing is broken. Transfer abandonment means your team needs training on warm handoffs.
Formula: Calls that reached voicemail ÷ total inbound calls
Why it matters: Voicemail is not “a message.” It’s often the moment the customer tries the next dealer.
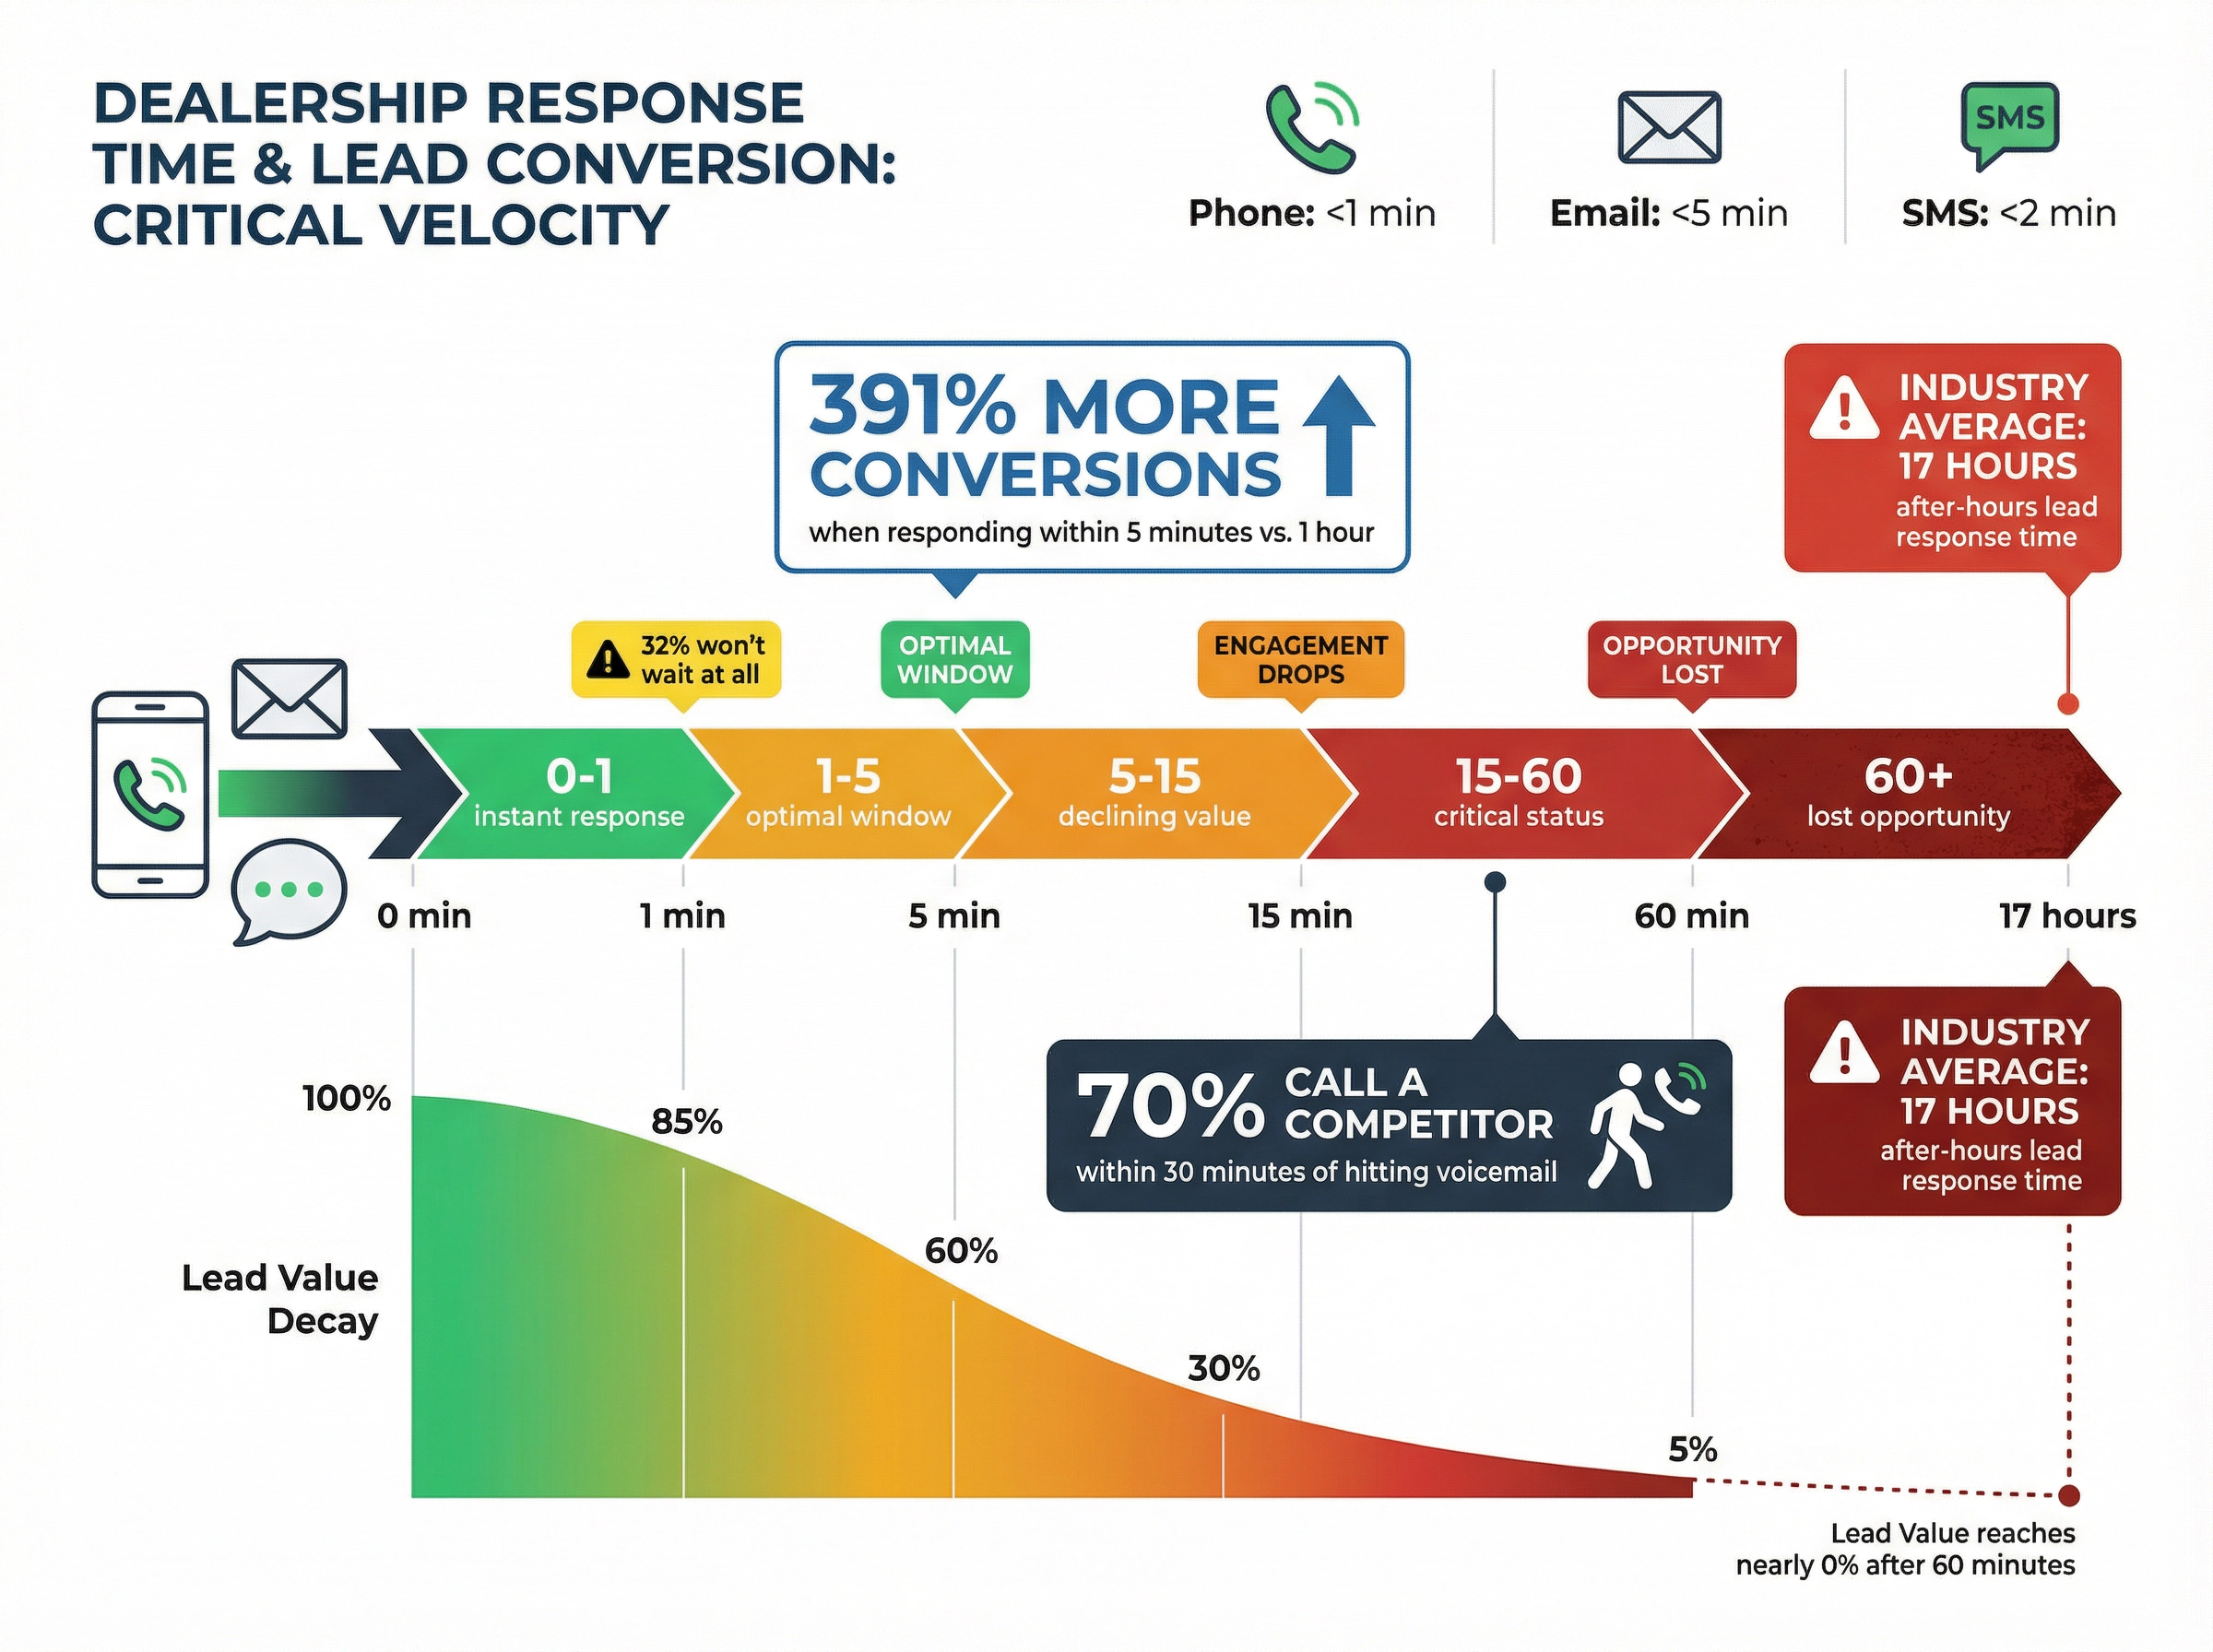
Industry data suggests that 70% of people who hit voicemail call a competitor within approximately 30 minutes. Treat this as directional, but don’t ignore the behavioral reality. Customers shopping for cars or service don’t have patience for callback roulette.
Track voicemail rate separately for:
This reveals where voicemail is happening and why. If your after-hours voicemail rate is 90%, you have an opportunity to capture revenue that’s currently evaporating. If voicemails spike during lunch hour, you’re understaffed at that time.
This applies to web leads, chats, inbound texts, and emails.
Track:
Why it matters: Lead value decays over time because the customer’s problem is still unsolved and switching cost is near-zero.
Research shows the average response time for after-hours leads is 17 hours, yet engaging a customer immediately can drive 391% more conversions. Every minute of delay makes the prospect more likely to lose interest or contact a competitor.
2026 requirement: Track this by channel because a “fast email” is not the same as a fast text.
How to improve:
Formula: # leads that received 2+ channels of outreach within the first X minutes ÷ total leads
Why it matters: You don’t know which channel the customer will notice.
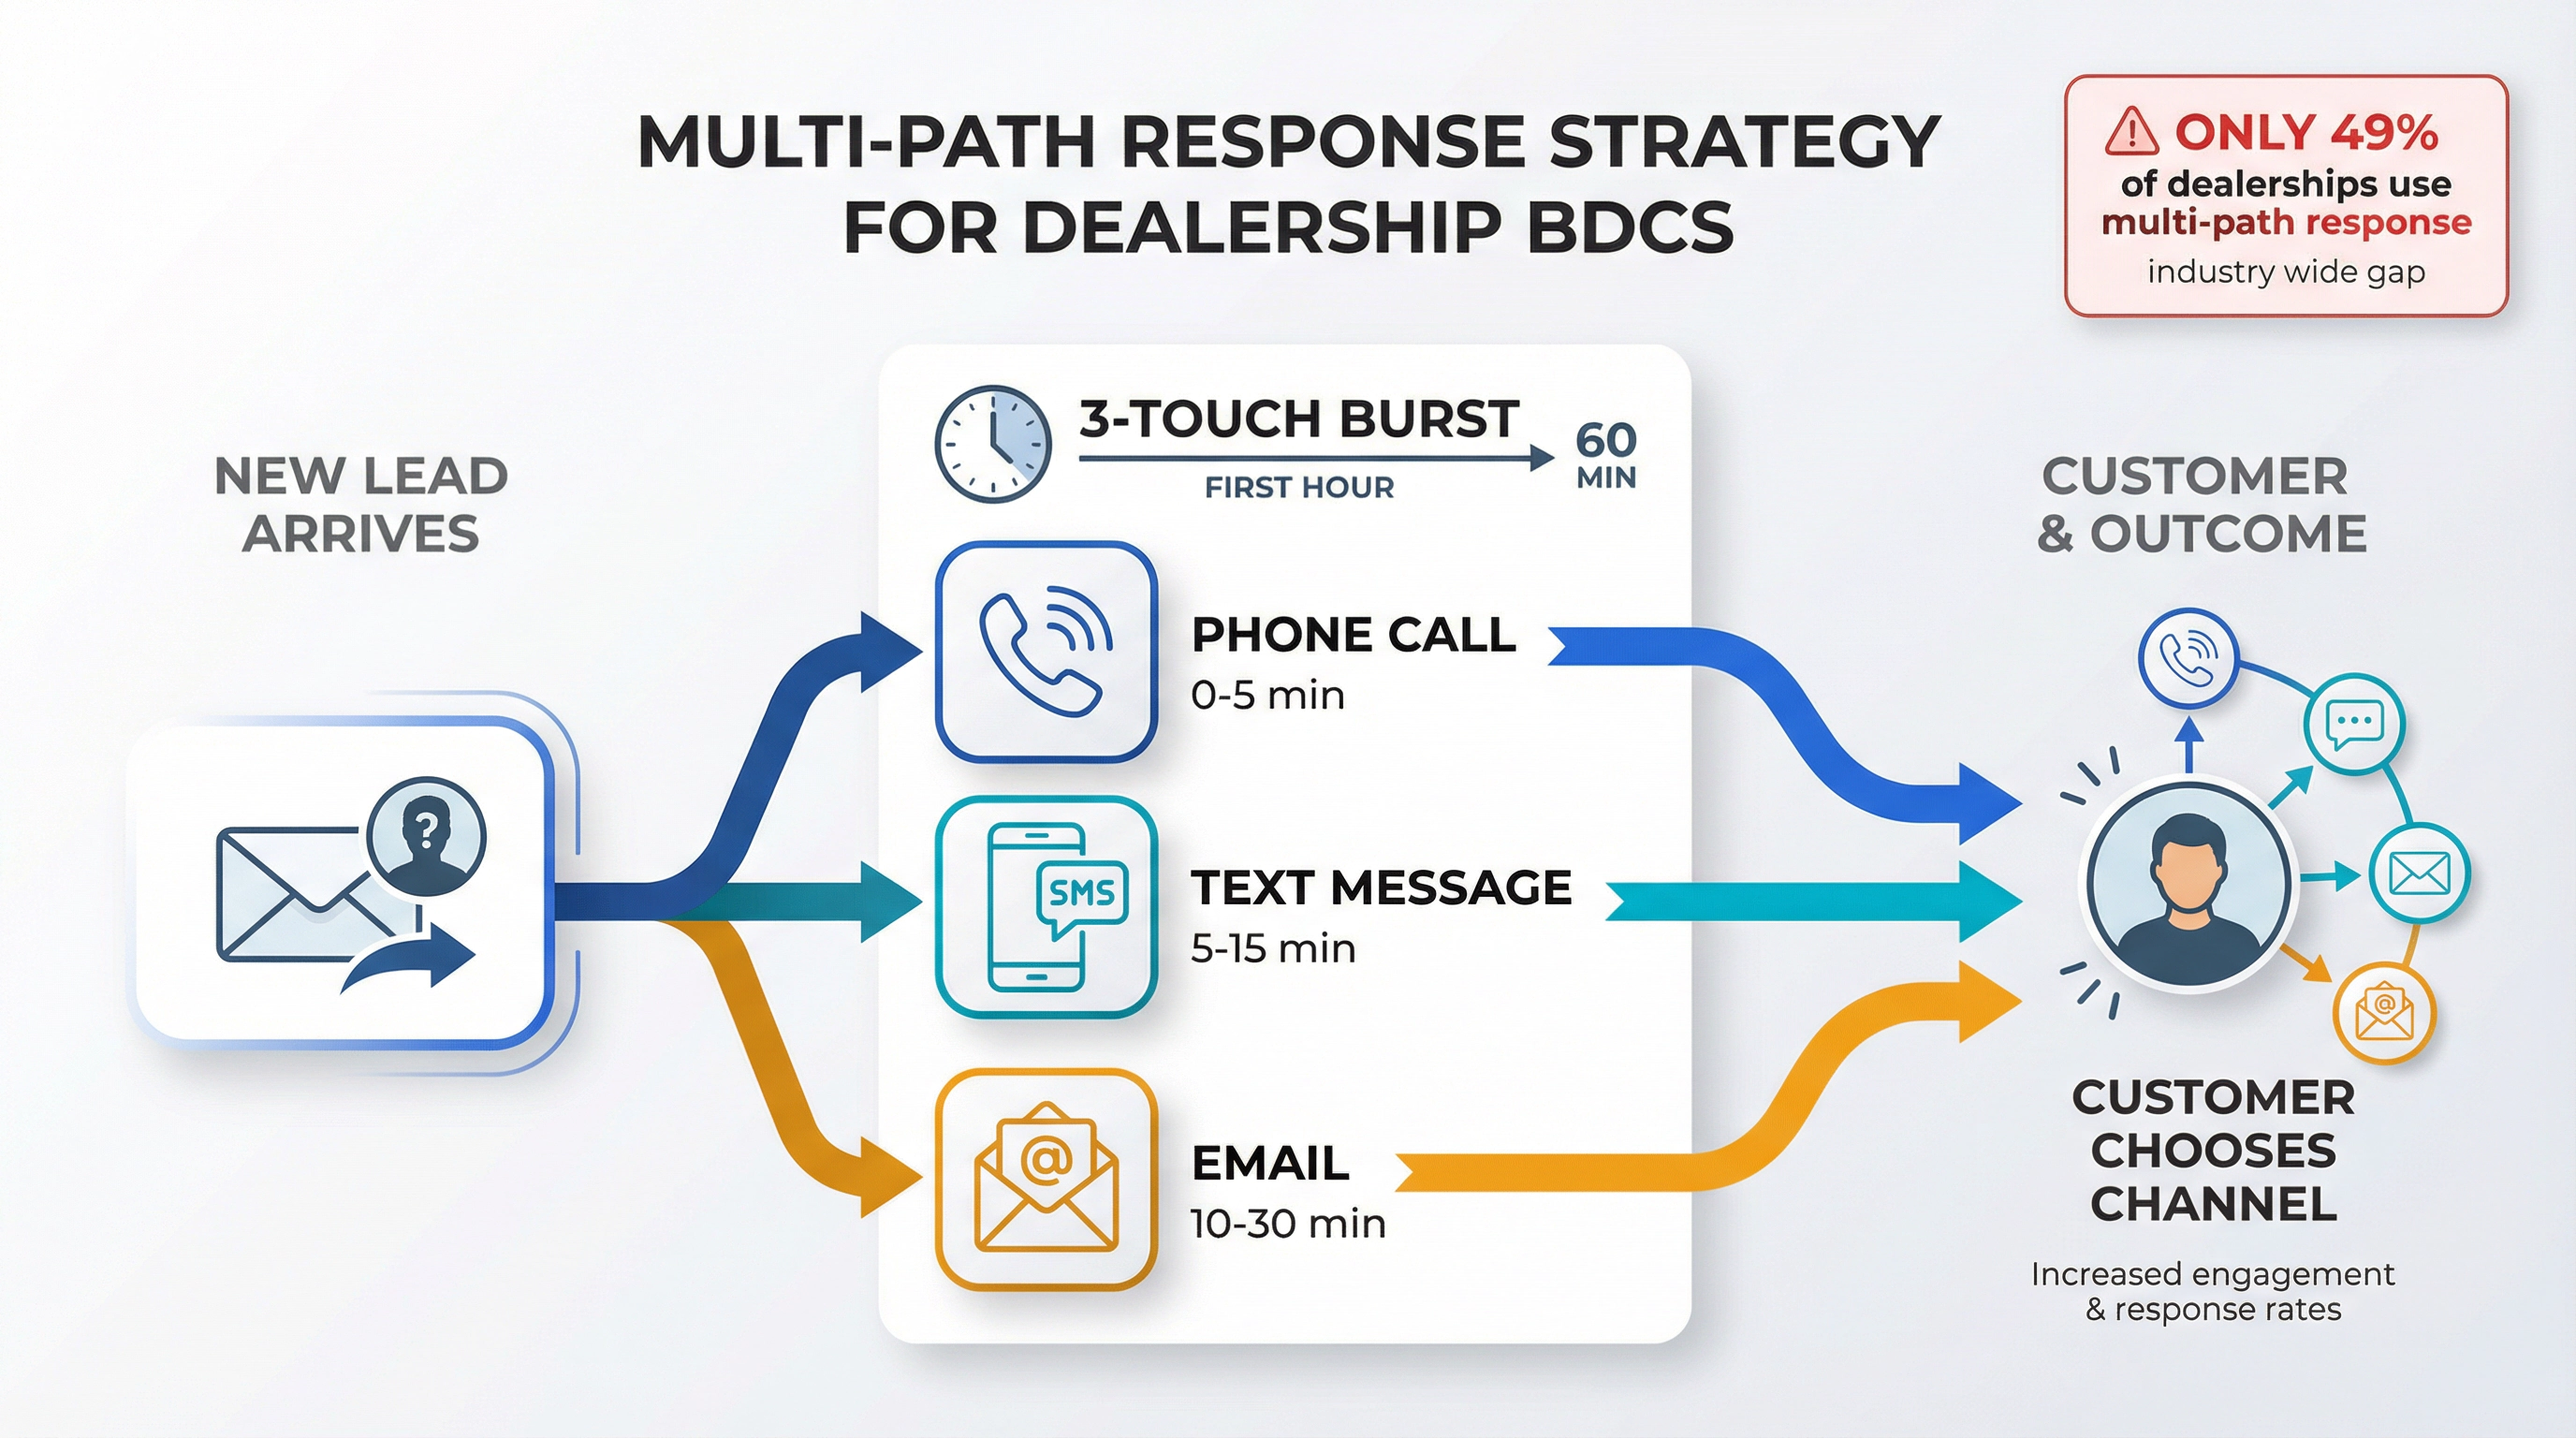
Research highlights that multi-path response is still underused. Only 49% of dealerships responded through multiple channels (email + phone + text), even though this approach significantly improves contact rates.
Action: Standardize a 3-touch “burst” (call + text + email) for new leads within the first hour, then let the customer choose the channel going forward.
How to improve: Use CRM automation to trigger multi-channel sequences automatically. One attempt on one channel is a recipe for missed connections.
This is the metric most stores confuse with “response.”
Definition: A customer replies or speaks to you in a real back-and-forth conversation.
Formula: # opportunities where contact was made ÷ total opportunities attempted
Critical reality: Industry coaches estimate 30 to 40% of “hot” leads never get any follow-up at all. That’s essentially throwing away opportunities.
Why it matters: You cannot qualify or set an appointment without contact.
Track contact rate by:
This quickly exposes where your process is failing. If internet leads have an 80% contact rate but third-party leads sit at 50%, you need a different approach for those prospects.
How to improve:
This is the most under-tracked coaching KPI in dealerships.
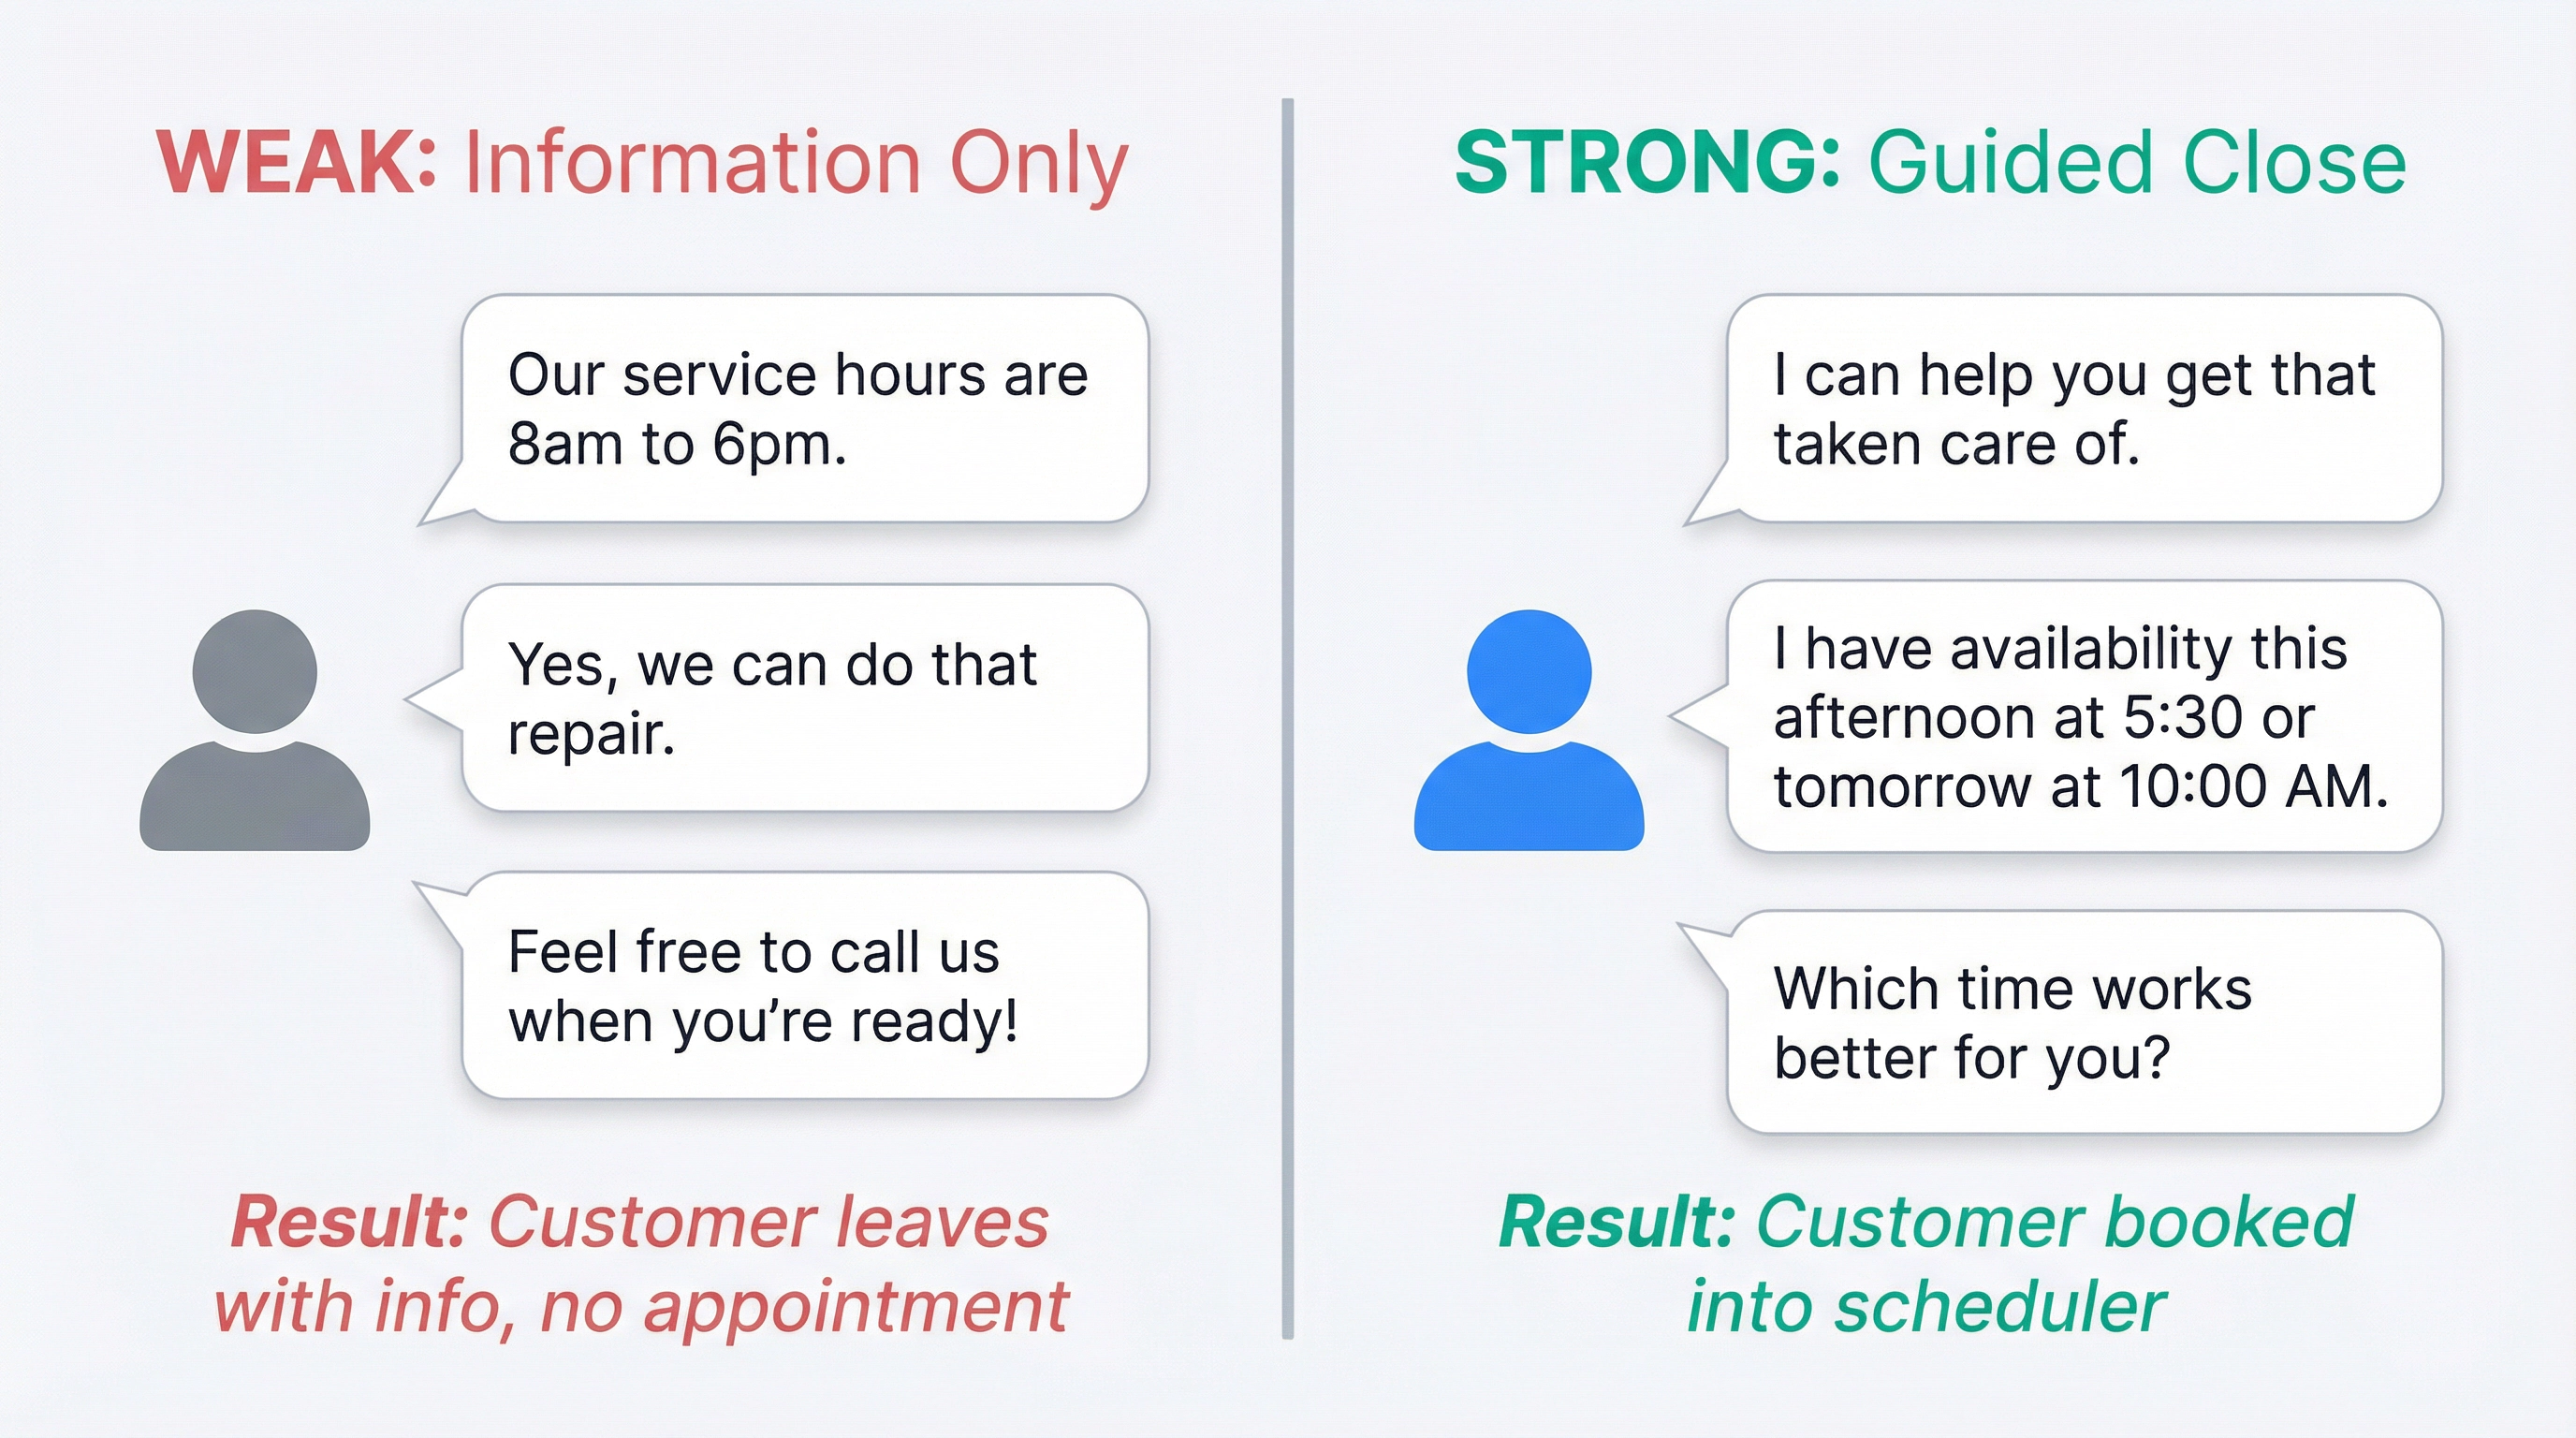
Definition: In qualified opportunities, did you clearly ask for the appointment or propose specific next steps?
Formula: # qualified opportunities where an appointment was offered ÷ total qualified opportunities
Why it matters: Many teams “answer questions” and end the call. The customer leaves with information, not an appointment. If you’re not measuring whether reps actually ask for the appointment, you’re missing a huge conversion leak.
Action: QA 10 random conversations per rep per week. Score “appointment offered: yes/no.” You’ll be shocked how many conversations end without a clear ask.
Formula: Appointments set ÷ qualified opportunities
Why it matters: This is where skill, process, and tools collide. It’s also where you can improve without buying more leads.
Warning: This metric is meaningless if your qualification definition is sloppy. If you’re calling tire-kickers “qualified,” your set rate will be artificially low.
What to track:
How to improve:
Top performers hit 50 to 60% set rate on qualified opportunities. Average is 25 to 30%. If you’re below that, refine your conversation to focus on why the customer should visit and why now.
For service, this is often “arrived” or “RO written.” For sales, it’s showroom visit.
Formula: Appointments kept ÷ appointments set
Why it matters: Set rate is easy to inflate. Kept rate is reality.
Top performers maintain a 70 to 80% show rate. If you’re booking 100 appointments but only 50 show, you’ve wasted slots that could have gone to real opportunities.

What to track:
How to improve:
This is the metric that ties BDC behavior to the P&L.
Formula (service example): Total service gross attributable to kept BDC-set appointments ÷ kept BDC-set appointments
Why it matters: It lets you answer, with math, “What is one kept appointment worth here?”
If you know each kept appointment generates $250 in gross profit and your BDC costs $10,000/month while delivering 200 kept appointments, that’s $50,000 in gross from a $10,000 investment.
Concrete examples (case studies):
We’ve seen this play out in real numbers with dealerships using AI-powered BDC solutions:
| Dealership | Calls Handled | Appointments Booked | Profit Impact | Per Appointment |
|---|---|---|---|---|
| Lexus (Bay Area) | ~1,100 | 376 | $100,000 | ~$266 |
| CDJR (Bay Area) | 1,563 | 304 | $83,000 | ~$273 |
| Toyota | 1,053 | 358 | $94,000 | ~$263 |
These are case studies (not universal benchmarks), but they show the math: when you improve BDC metrics systematically, the revenue impact is measurable and significant.
Track this metric to:
Once the 12 core metrics are stable, add these. They’re the levers that make results repeatable.
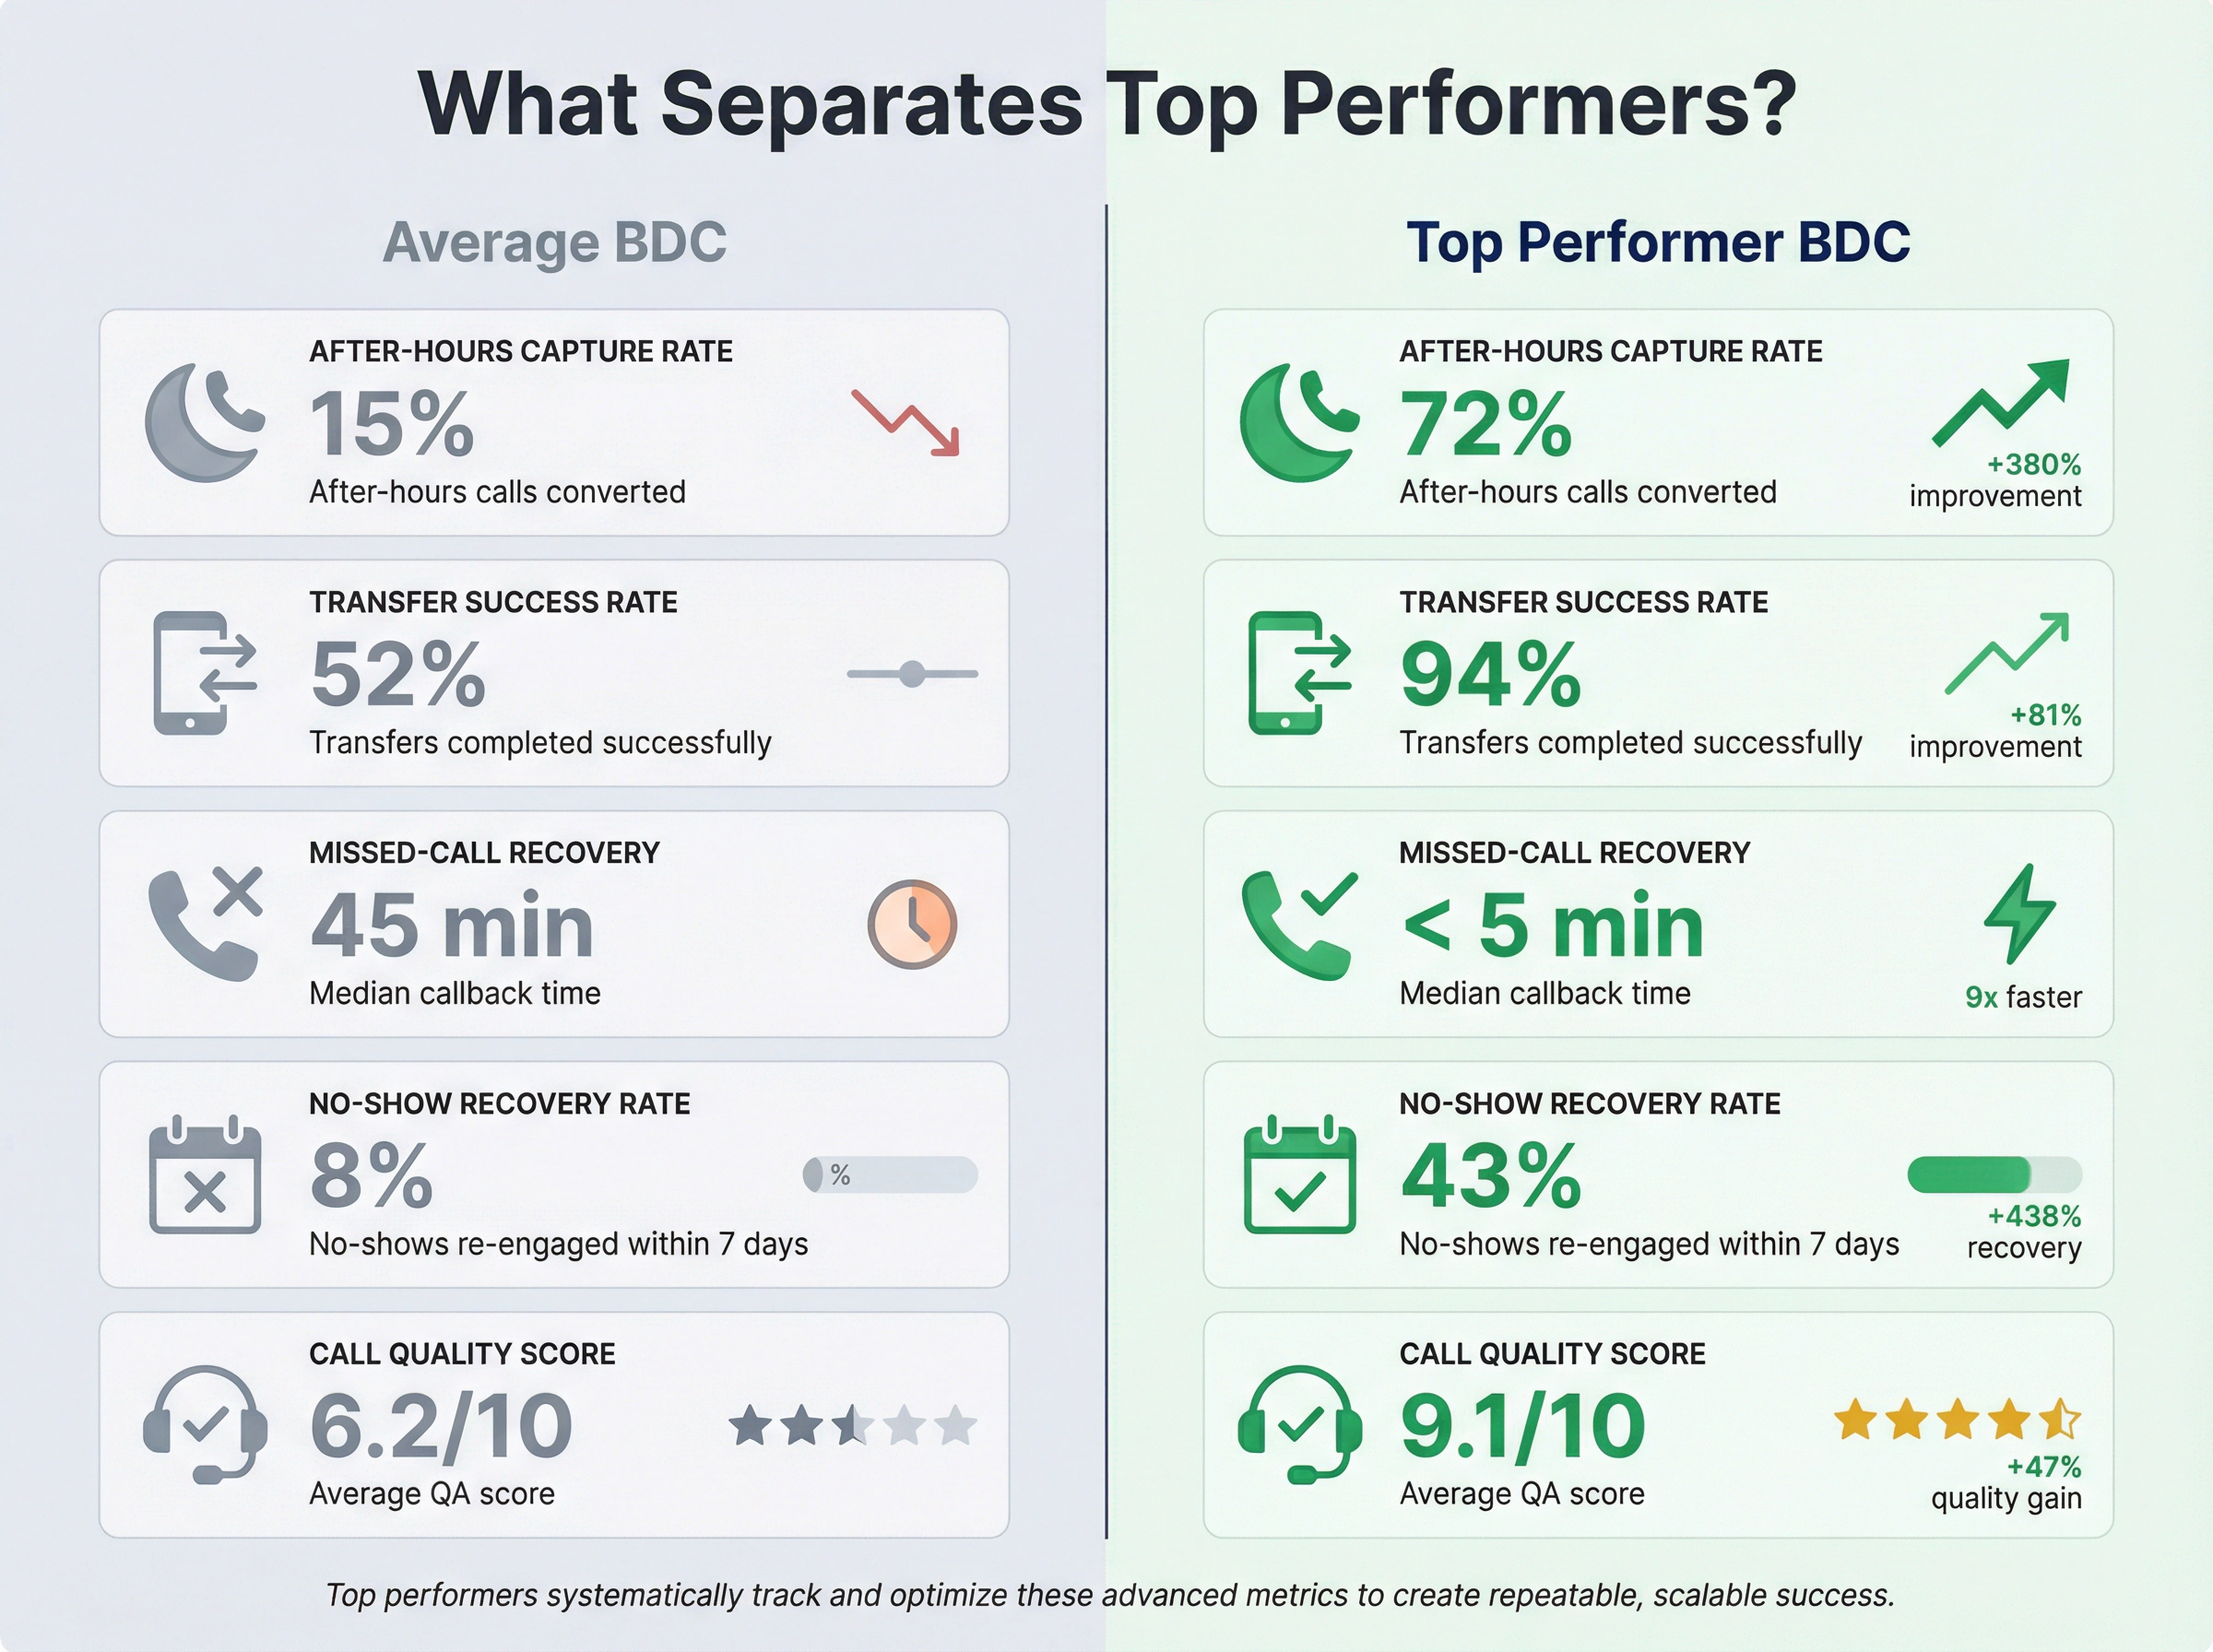
Definition: % of inbound demand outside staffed hours that results in (a) contact or (b) appointment.
Why this matters in 2026: 56 to 60% of dealership leads arrive after business hours. If you’re closed or dumping those calls to voicemail, you’re systematically losing more than half your demand. After-hours is where 24/7 coverage solutions (human or AI) create outsized ROI.
Track:
This reveals whether your after-hours solution is actually working or just checking a box.
Definition: When you transfer a call, did the customer successfully reach a person who can solve their problem?
Track:
Why this matters: If 30% of your transfers result in hang-ups or voicemail, you’re burning leads that already made it past the first hurdle.
Track missed-call recovery like it’s a sales process (because it is).
Track:
Definition: Of no-shows, how many were re-engaged into a new kept appointment within 7 days?
Most stores ignore this and complain they need more leads. A no-show isn’t a lost sale. It’s a customer who wanted to engage but something got in the way. Call them and reschedule.
Pick 5 things you care about and score them consistently:
If you cannot score quality, you cannot coach quality.
A service BDC that only tracks calls and appointments is blind to the “factory” it’s feeding. Connect your BDC dashboard to these service-side metrics:
Definition: How far out are you booking?
Why it matters: Long lead times push customers to independents or other dealers. If someone calls today for an oil change and you can’t fit them in for two weeks, they’re not waiting.
Definition: % of arrived appointments that result in an RO written and work performed.
Why it matters: If your show-to-RO rate is low, either your BDC is setting weak appointments or your service advisors aren’t converting arrivals into work.
These are shop health metrics, but they determine the true value of BDC success.
Industry operational performance guides include metrics such as:
| Shop Metric | Common Benchmark |
|---|---|
| Technician proficiency | 120-125% |
| Stall utilization | 75% minimum |
You’re not trying to copy a benchmark. You’re ensuring your BDC isn’t overbooking a broken process or underbooking a healthy one.
Track these four religiously:
① Lead-to-Appointment (Set) Rate
How many leads turn into scheduled showroom visits?
② Appointment-to-Show (Visit) Rate
How many scheduled visits actually happen?

③ Visit-to-Sold Rate
Once they’re in the showroom, how often do they buy?
④ Gross per Sold from BDC-Set Appointments
What’s the profit per deal that came through the BDC?
Industry research on lead effectiveness shows measurable variation across brands, so tracking these by source gives you a competitive edge.
Teams buy AI to “answer every call,” then only measure “calls handled.” That’s like measuring “how many people walked up to the register,” not whether anyone bought anything. If AI is in your communication stack, track these:
Definition: % of interactions fully resolved without human involvement (scheduled, answered, completed).
This is your efficiency metric. If your AI handles 1,000 calls but only resolves 200 without escalation, it’s not automating much.
When the AI escalates, did it escalate for the right reason, to the right department, with the right context?
Bad AI dumps everything to humans. Good AI knows when it’s stuck and hands off intelligently.
AI that books appointments incorrectly creates more work than it saves. Track these errors religiously.
Did the appointment actually land in the scheduler/DMS/CRM reliably?
If your AI “books” appointments that never appear in your systems, you have an integration problem that will kill customer trust fast.
Your AI vendor should report response latency clearly. If your AI takes 15 seconds to respond to a caller, that’s not acceptable. Top AI systems respond in under 2 seconds.
We built our AI communications platform specifically because we saw dealerships losing massive revenue from the metrics gaps discussed above.

Our AI voice agents answer every inbound call instantly, 24/7, with no hold times and no voicemail. We built our voice infrastructure from scratch (not off-the-shelf components bolted together), so conversations feel natural and response is instantaneous.
The Lexus case study showed zero missed calls out of ~1,100 handled, with 88% of bookable calls converted to appointments.
Whether it’s 2pm or 2am, we respond immediately across phone, SMS, and email. If a customer calls, we follow up via text with appointment details. If they text, we continue the conversation in their preferred channel. No 17-hour wait times. No leads sitting unworked overnight.
Our AI books appointments directly into your scheduler and pushes lead information to your CRM. We integrate with existing DMS, CRM, and scheduling systems so appointments land correctly the first time. Our bookable rate is industry-leading because we built deep integrations that actually work, not surface-level APIs that fail under real-world complexity.
The math compounds quickly. One CDJR dealership went from 205 monthly service appointments to 448 in the first month, generating $83,000 in profit from BDC-set appointments alone. Our case studies show monthly profit impacts of $80,000 to $100,000+ per dealership.
If you’re serious about improving BDC performance in 2026, tracking metrics is step one. Automating the improvements is step two. See how our platform can help.
If you text customers or use automated voice tech, you need a compliance dashboard. Not because it’s fun, but because the downside is asymmetric.
Track:
Why this matters now: The FCC’s February 2024 action clarified that AI-generated voices in robocalls are treated as “artificial/prerecorded” under TCPA rules, and TCPA consent revocation requirements have had shifting effective dates. This is not legal advice, but track the operational behaviors that keep you safe.
Most dealership KPI fights are not about performance. They’re about definitions.
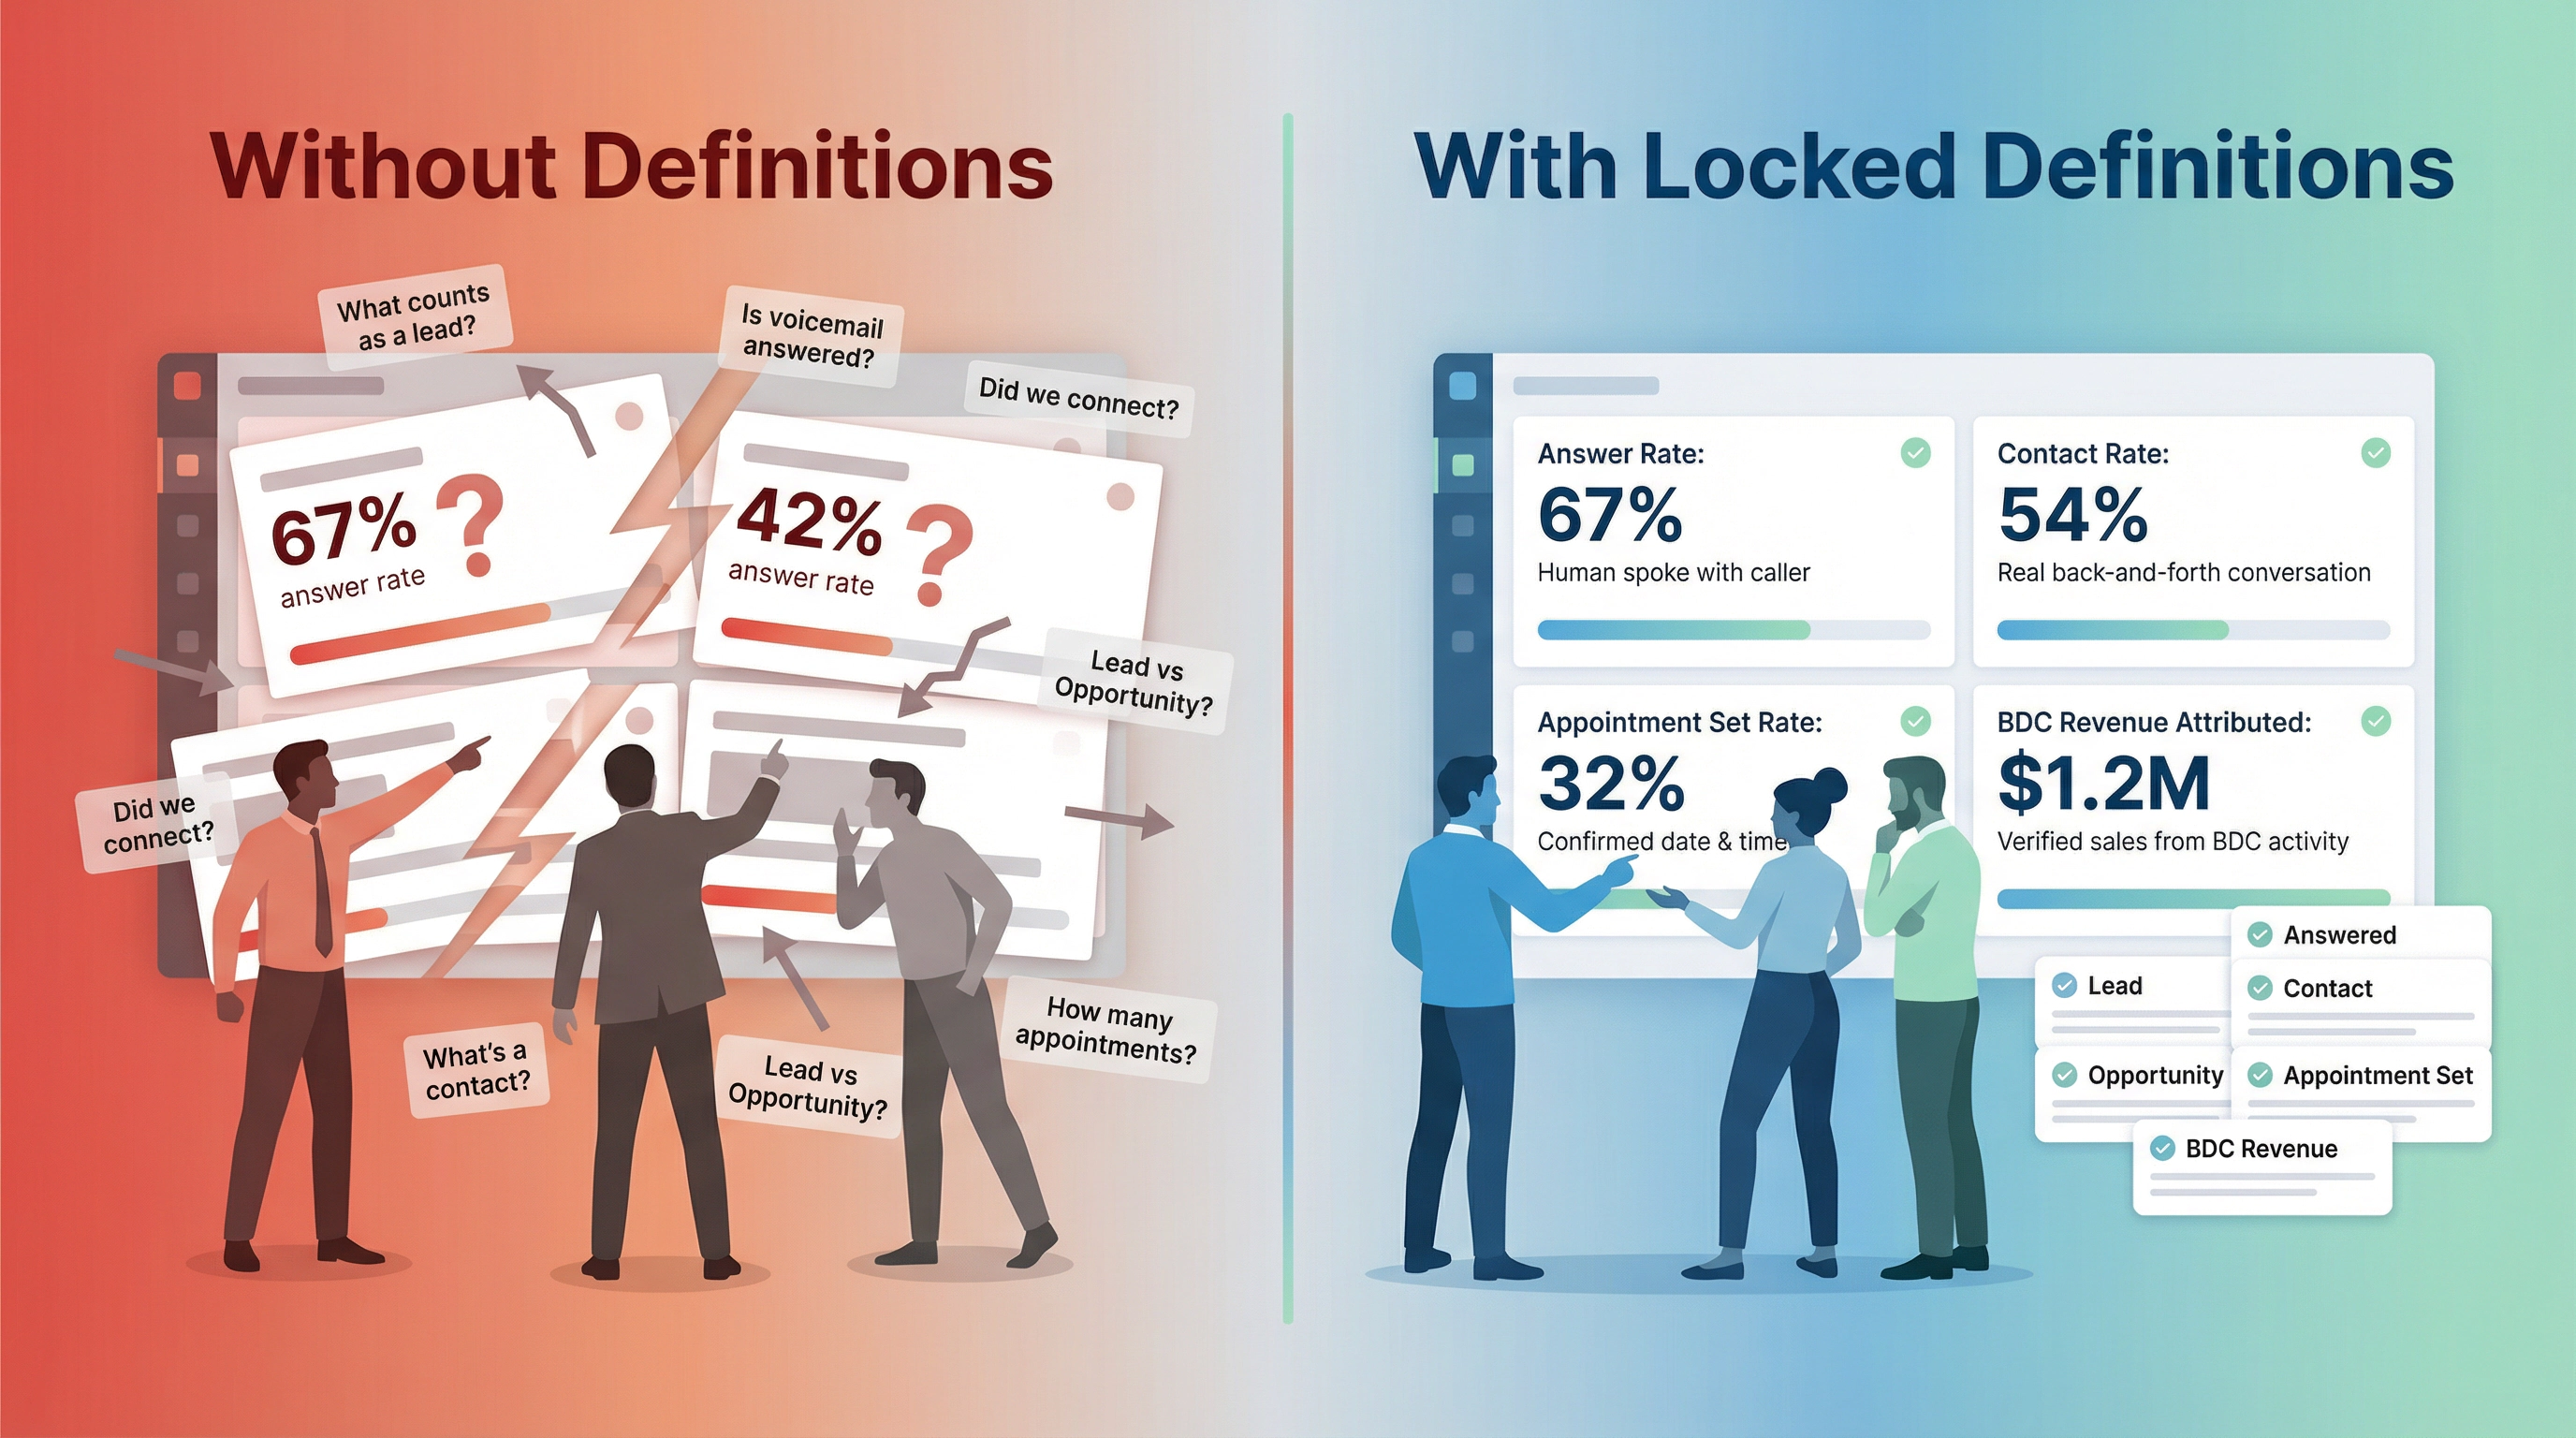
Before you judge a number, write a one-sentence definition for:
Then lock those definitions for a quarter. If you change definitions every month, your KPIs become storytelling, not measurement.
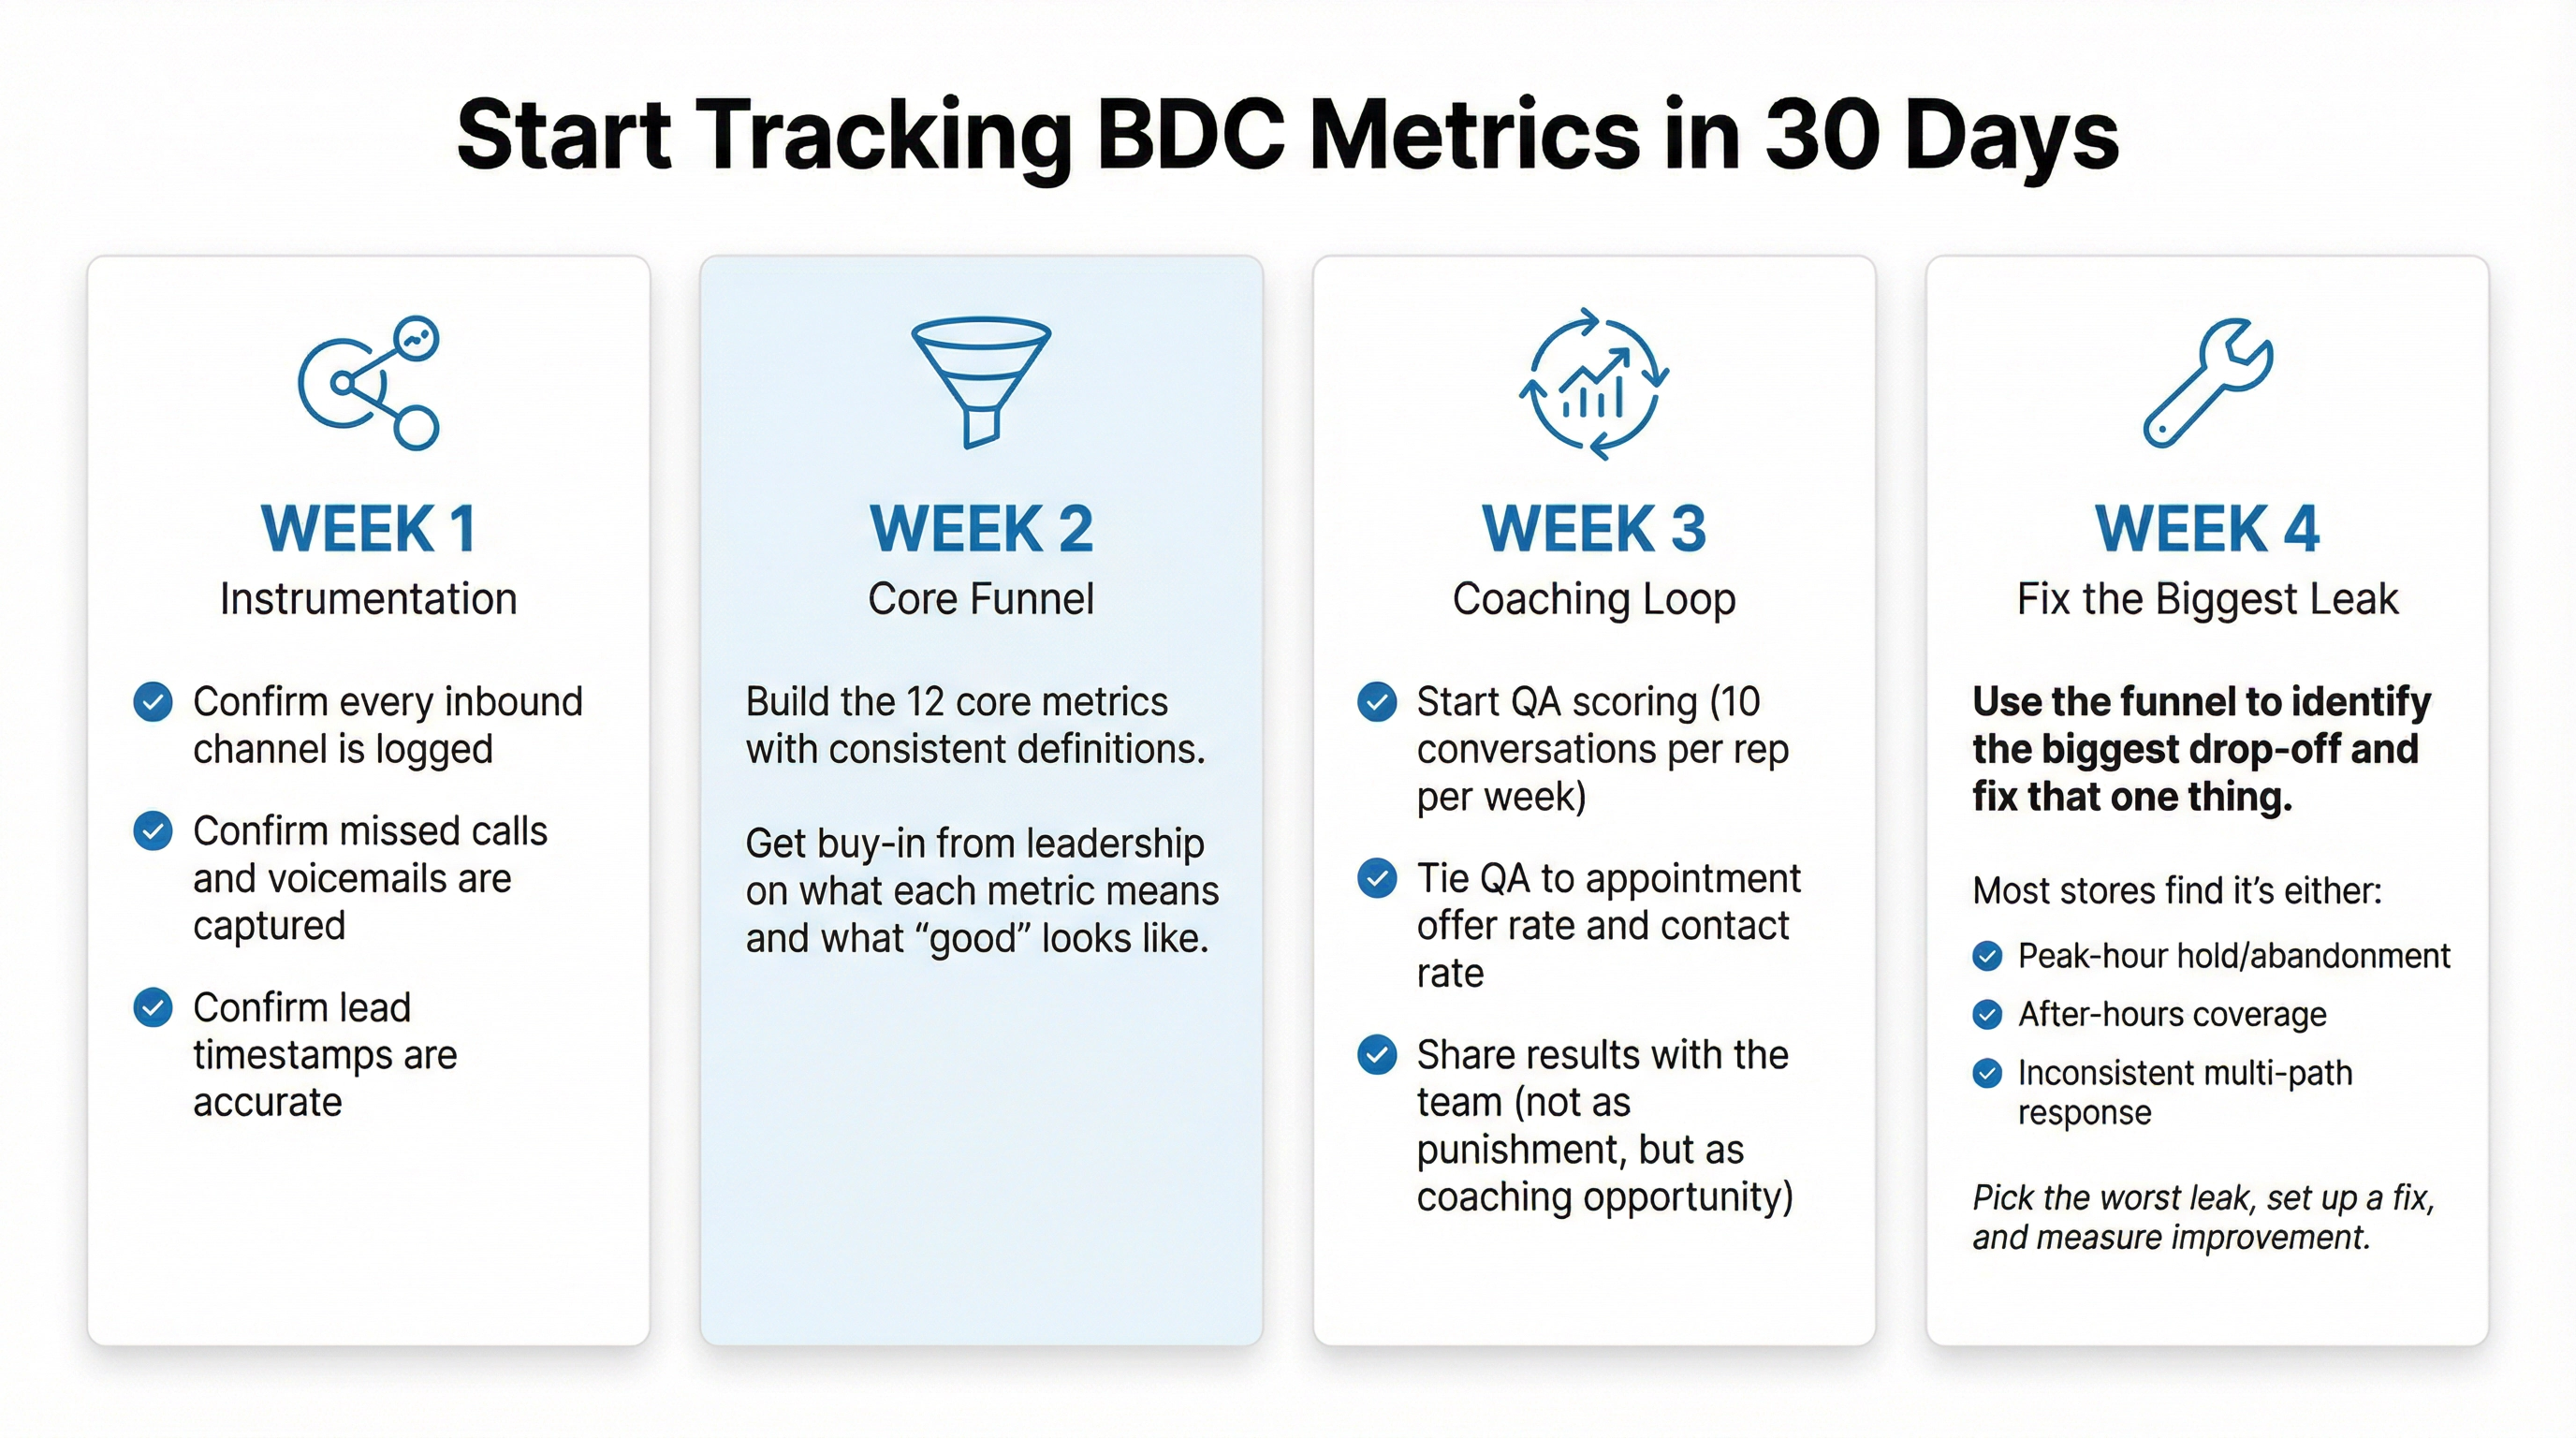
Build the 12 core metrics with consistent definitions. Get buy-in from leadership on what each metric means and what “good” looks like.
Use the funnel to identify the biggest drop-off and fix that one thing. Most stores find it’s peak-hour abandonment, after-hours coverage, or inconsistent multi-path response. Pick the worst leak, fix it, and measure improvement.
The most important BDC metrics are the ones that directly influence sales and service revenue. Full stop.
If you’re just starting to tighten up BDC tracking, prioritize these four first:
Master those, then layer on contact rate, multi-path response, and gross per appointment. If everything’s important, nothing is.
Success in BDC is a cycle: measure, understand, improve, repeat. You find response time is 1 hour (too slow), set up changes, watch it drop to 5 minutes, and see appointments rise. You notice show rates lagging at 50%, start a reminder system, get shows up to 70%, and see more sales close.
Each metric is a lever you can pull to capture more business. In an industry where availability and responsiveness determine who gets the sale, these metrics are what will set you apart in 2026.
Build your scoreboard. Fix the leaks. Win the business your competitors are losing.
As seen in